Research prototype · 2026

ARMD-Predict: Multi-Site Machine Learning to Predict Antibiotic Resistance before Culture Results

Fateme Nateghi Haredasht1,*,†, Nicholas P. Marshall1,*, Wenyuan Chen1, Lauren N. Cooper2, Ziming Wei3, Harrison Konsker1, Jacob S. Chen1, Michael Klompas3,4, Cara McKenna3,4, Richard J. Medford2,5, Sanjat Kanjilal3, Austin J. Schoeffler1, Stephen P. Ma1, Niaz Banaei1, Steven M. Asch1, Amy Chang1, Stanley C. Deresinski1, Mary K. Goldstein1, Robert Tibshirani1, Jonathan H. Chen1

1Stanford University 2UT Southwestern Medical Center 3Harvard Medical School and Harvard Pilgrim Health Care Institute 4Brigham and Women's Hospital 5East Carolina University

*Contributed equally. †Corresponding author.

How ARMD-Predict produces a patient-specific antibiogram A patient record from before the culture order (prior resistant culture, recent antibiotic exposure, age band, sex and care setting, Area Deprivation Index) flows into a pooled four-site model with monotonic constraints. The model outputs a probability of susceptibility for each candidate antibiotic. An optional local antibiogram re-anchors each estimate to the hospital's own resistance rate without changing the ranking. The bars are illustrative. BEFORE THE ORDER Patient record Prior resistant culture Recent antibiotic exposure Age band, sex, care setting Area Deprivation Index Pooled four-site model monotonic constraints no site identity one model per antibiotic OUTPUT Patient-specific antibiogram Probability of susceptibility (illustrative) Ceftriaxone Cefepime Gentamicin Meropenem OPTIONAL Local antibiogram re-anchors each estimate; ranking kept
7.4 millionculture–antibiotic results
415,952culture orders
241,227patients
4U.S. health systems

Overview

A patient-specific antibiogram, at the moment a culture is ordered

Organism identification and susceptibility testing can take several days, so clinicians often choose empiric antibiotics before results are available. During that interval they rely on the hospital antibiogram: the share of recovered isolates that were susceptible to each antibiotic, reported once for all patients.

ARMD-Predict estimates the same quantity for one patient. From information recorded up to the culture order, it estimates the probability that all tested organisms recovered from the culture will be susceptible to each candidate antibiotic. The models were trained on 7.4 million culture–antibiotic results from 415,952 culture orders in 241,227 patients at Stanford Health Care, East Carolina University Health (ECUH), UT Southwestern Medical Center (UTSW) and Mass General Brigham (MGB). Separately trained and evaluated models predict the likely organism and organism-specific resistance phenotypes, including proxies for categories in the 2024 IDSA guidance.

Hospital antibiogram

One number for every patient

For ceftriaxone in inpatient urine cultures, the training-period antibiogram assigned 13.6% resistance to every patient, whatever their history. It cannot separate resistant from susceptible orders.

ARMD-Predict

An estimate for this patient

The estimate draws on the patient's own record: earlier resistant cultures, recent antibiotics, care setting, age band and neighborhood deprivation. Two patients on the same ward can receive different estimates for the same antibiotic.

How it works

Two components built on one set of pre-order features

Both components use information recorded up to the culture order: demographics, care setting, prior resistance and infection, prior antibiotic exposure, prior procedures, comorbidities, laboratory values and the Area Deprivation Index.

COMPONENT 1

Empiric susceptibility

One XGBoost model per antibiotic, specimen and care setting returns the probability that the organisms recovered from the order are susceptible to that antibiotic.

  • 23 pooled four-site models: 7 inpatient urine, 7 outpatient urine, 7 inpatient blood and 2 respiratory.
  • Released models omit site identity. At MGB, the only hospital in this comparison, a site-agnostic pooled model performed nearly identically to a site-aware one.
  • The public web app uses a short form restricted to five feature blocks a clinician can report at ordering: demographics, care setting, prior resistance, prior infection and prior antibiotic exposure.
COMPONENT 2

Organism and resistance phenotype

Three stages address Gram class, organism identity and organism-specific resistance. Each stage was trained and evaluated separately, not as an end-to-end cascade.

  • Gram stain: pooled held-out AUROC 0.72.
  • Organism identification: the 20 most frequent organisms per specimen and setting, plus Other.
  • 30 phenotype models aligned with the 2024 IDSA guidance: proxies for ESBL production and CRE, measured resistance in organisms at moderate risk of AmpC production, and non-susceptibility of P. aeruginosa to individual agents, with MRSA and VRE as Gram-positive complements. AUROC ranged from 0.519 to 0.834, evaluated given the laboratory-reported organism. Phenotype models are not shown in the public web app.
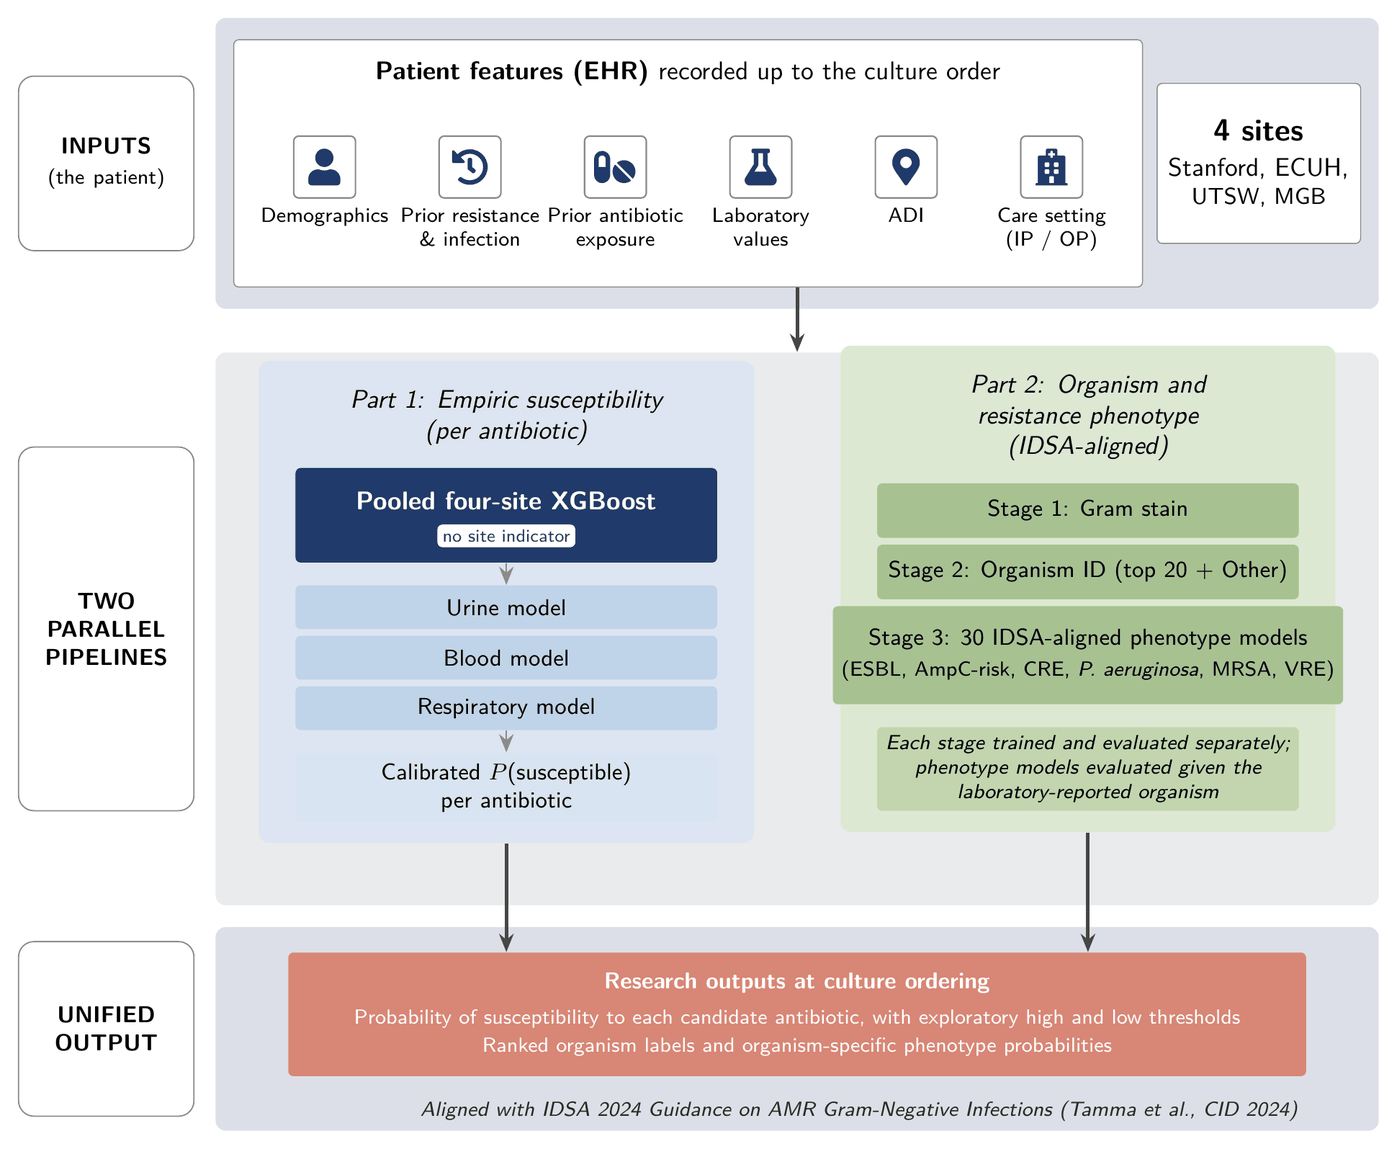
ARMD-Predict framework diagram. Inputs: patient features recorded up to the culture order (demographics, prior resistance and infection, prior antibiotic exposure, laboratory values, Area Deprivation Index and care setting) from four sites: Stanford, ECUH, UTSW and MGB. Two parallel pipelines. Part 1, empiric susceptibility per antibiotic: a pooled four-site XGBoost with no site indicator, with urine, blood and respiratory models, giving a calibrated probability of susceptibility per antibiotic. Part 2, organism and resistance phenotype, IDSA-aligned: stage 1 Gram stain, stage 2 organism identification (top 20 plus Other), stage 3 thirty IDSA-aligned phenotype models (ESBL, AmpC-risk, CRE, P. aeruginosa, MRSA, VRE); each stage was trained and evaluated separately, and phenotype models were evaluated given the laboratory-reported organism. Unified output: research outputs at culture ordering, the probability of susceptibility to each candidate antibiotic with exploratory high and low thresholds, and ranked organism labels with organism-specific phenotype probabilities.
The ARMD-Predict framework. A shared set of EHR features recorded up to the culture order feeds two research pipelines, each trained and evaluated separately. Phenotypic proxies align, where applicable, with the 2024 IDSA guidance on antimicrobial-resistant Gram-negative infections.

Design choices that keep the estimates sensible

Prior resistance cannot lower predicted resistance

Monotonic constraints apply to prior resistance, prior infection and overall prior antibiotic exposure. A patient with an earlier resistant culture is never scored as less likely to be resistant than an otherwise identical patient without one.

No same-day history

History records dated the same day as the culture were excluded at every site, because whole-day dates cannot show that the event came before the order. Two exceptions: nursing-home contact, whose records mostly carry the culture day, and laboratory summaries, which cover the 14 days up to and including the day of the order.

No patient in two partitions

Each patient's orders fall in exactly one of the training, validation and test partitions (a random patient-grouped 60/20/20 split).

Data

Four health systems, each with a public de-identified release

Each system has released a de-identified Antibiotic Resistance Microbiology Dataset (ARMD), available under the access terms of its repository.

Stanford, California

Stanford Health Care

Patients
64,677
Culture orders
112,508
Culture dates
2007–2024
ARMDDryad · doi:10.5061/dryad.jq2bvq8kp
Greenville, North Carolina

East Carolina University Health

Patients
62,354
Culture orders
105,725
Culture dates
2014–2025
ARMD-ECUHDryad · doi:10.5061/dryad.7sqv9s55x
Dallas, Texas

UT Southwestern Medical Center

Patients
45,194
Culture orders
84,434
Culture dates
2006–2025
ARMD-UTSWDryad · doi:10.5061/dryad.0rxwdbsd5
Boston, Massachusetts

Mass General Brigham

Patients
69,002
Culture orders
113,285
Culture dates
shifted
ARMD-MGBPhysioNet, credentialed access · doi:10.13026/2r5k-b955

Counts are from the paper's cohort table and cover adults with urine, blood or respiratory cultures; patients are not deduplicated across health systems. MGB applied patient-specific date shifts during de-identification, so no calendar window is given. The paper's Stanford, ECUH and UTSW analyses used the public releases, with later versions of some files. The paper's MGB analysis used a 2026 extraction from the same health system that is not part of the public ARMD-MGB release; access to that extraction requires approval from Mass General Brigham under a data-use agreement.

Results

Held-out performance of the 23 empiric models

Full-feature pooled models, evaluated on held-out patients from a random patient-grouped split.

0.77median AUROC, inpatient urine7 models
0.70median AUROC, inpatient blood7 models
0.71median AUROC, outpatient urine7 models
0.82AUROC, each respiratory model1 inpatient, 1 outpatient
Held-out AUROC with 95% confidence intervals for the 23 pooled empiric-susceptibility models in four panels. Urine inpatient, median 0.773: meropenem 0.831, vancomycin 0.825, cefepime 0.807, ceftriaxone 0.773, piperacillin–tazobactam 0.699, gentamicin 0.679, ampicillin 0.629. Urine outpatient, median 0.708: levofloxacin 0.747, ciprofloxacin 0.743, cefpodoxime 0.733, cefazolin 0.708, TMP-SMX 0.673, nitrofurantoin 0.662, amoxicillin–clavulanate 0.638. Blood inpatient, median 0.703: meropenem 0.835, vancomycin 0.825, cefepime 0.704, ceftriaxone 0.703, piperacillin–tazobactam 0.658, gentamicin 0.656, ampicillin 0.637. Respiratory: ceftriaxone inpatient 0.825, levofloxacin outpatient 0.822.
Discrimination by antibiotic. Dots show AUROC and lines the 95% CI from 1,000 bootstrap replicates that resampled patients. Performance varied more by antibiotic than by site. Ampicillin was the weakest inpatient urine model: its result depends mostly on which organism is present, and the organism is not yet known when empiric therapy is chosen. * Most resistant labels in the blood meropenem cell came from orders with Gram-positive organisms, mainly staphylococci whose meropenem result was derived from oxacillin testing; a model retrained on Gram-negative orders only had AUROC 0.757 (95% CI, 0.691–0.824). † Cefpodoxime labels were inferred from laboratory implied-susceptibility rules.
Show the numbers (paper Table 1)
AntibioticTest ordersSusceptibleAUROC (95% CI)
Urine, inpatient
Ampicillin32,45144.2%0.629 (0.622–0.636)
Cefepime22,45494.6%0.807 (0.790–0.823)
Ceftriaxone27,96086.5%0.773 (0.764–0.782)
Gentamicin33,36389.4%0.679 (0.667–0.692)
Meropenem19,99698.8%0.831 (0.802–0.858)
Piperacillin–tazobactam29,19095.7%0.699 (0.683–0.715)
Vancomycin5,11193.5%0.825 (0.799–0.849)
Median (7 models)0.773
Urine, outpatient
Amoxicillin–clavulanate16,91982.0%0.638 (0.625–0.652)
Cefazolin24,72880.0%0.708 (0.698–0.718)
Cefpodoxime†17,10693.0%0.733 (0.711–0.752)
Ciprofloxacin26,66879.7%0.743 (0.733–0.753)
Levofloxacin25,57881.1%0.747 (0.736–0.757)
Nitrofurantoin29,60081.6%0.662 (0.653–0.672)
TMP-SMX27,86477.1%0.673 (0.663–0.682)
Median (7 models)0.708
Blood, inpatient
Ampicillin4,70433.4%0.637 (0.620–0.653)
Cefepime3,43292.9%0.704 (0.672–0.737)
Ceftriaxone4,97680.6%0.703 (0.684–0.721)
Gentamicin6,48990.6%0.656 (0.629–0.681)
Meropenem*4,11694.3%0.835 (0.809–0.862)
Piperacillin–tazobactam3,54394.3%0.658 (0.616–0.700)
Vancomycin4,51897.6%0.825 (0.785–0.866)
Median (7 models)0.703
Respiratory, inpatient
Ceftriaxone1,70240.6%0.825 (0.797–0.850)
Respiratory, outpatient
Levofloxacin3,03354.5%0.822 (0.792–0.847)
All 23 models375,501median 0.708

Compared with repeating the patient's last result

A simple alternative to a model is to repeat the patient's most recent earlier result for the same antibiotic, falling back to the antibiogram when there is none. For a median of 36.0% of test orders such a result existed (interquartile range, 28.0–41.4%), so the rule had no earlier result for 64% of orders.

ARMD-Predict model Repeat last result
All test orders · median of 23 models
Model
0.708
Last result
0.604
Orders with an earlier result · median of 22 models
Model
0.751
Last result
0.679
Same alert rate, similar yield. When the model raised as many alerts as the rule, the two flagged similar proportions of resistant orders (medians, 23.5% and 23.0%).
Ceftriaxone, inpatient urine. 5.7% of orders had a resistant earlier result. At that alert rate the model flagged 24.1% of resistant orders and the rule 23.6%, and 24.3% of the model's alerts fell on orders with no earlier result.
Where the rule did better. For several outpatient oral agents, including amoxicillin–clavulanate, cefpodoxime and TMP-SMX, the rule had a higher positive predictive value at its own alert rate.

Calibration

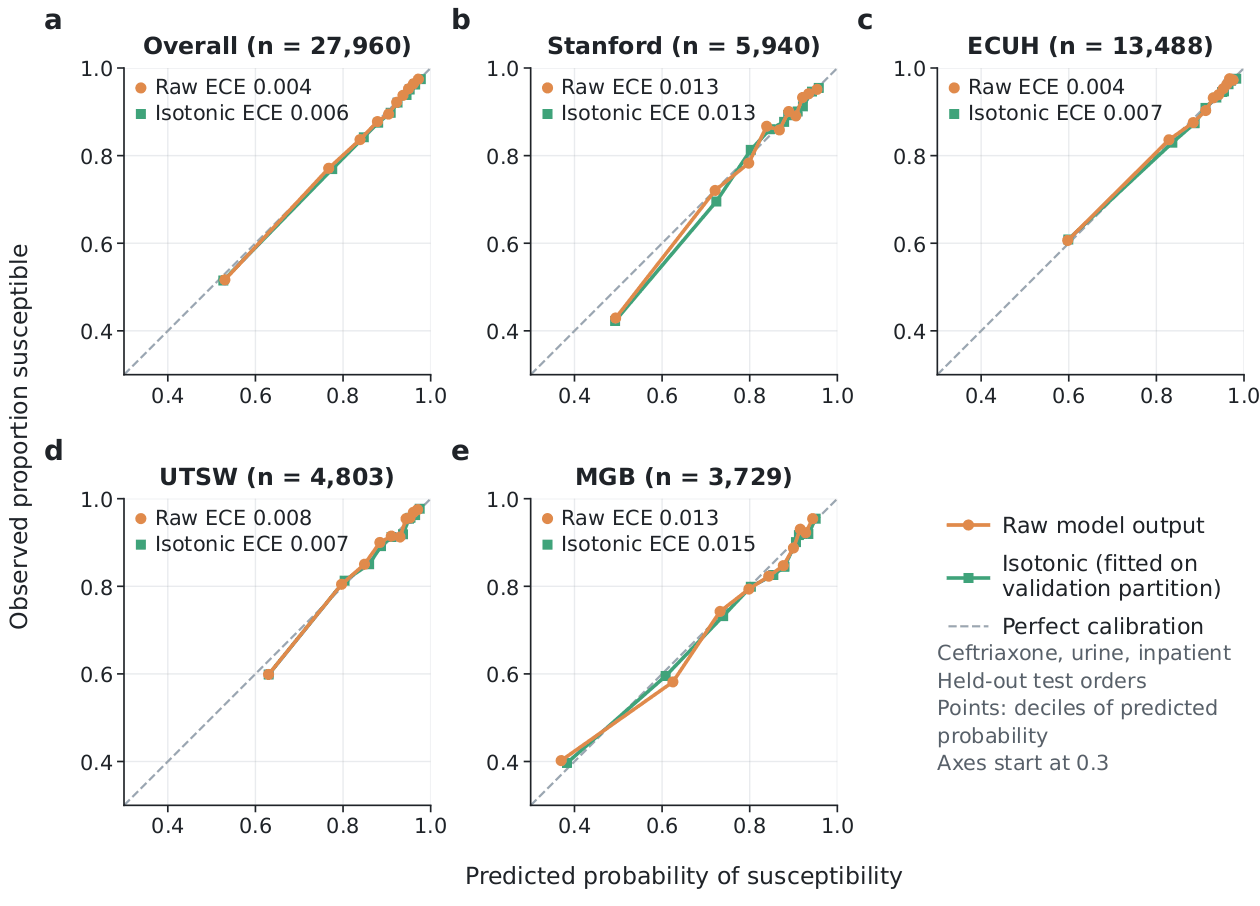
Calibration asks whether predicted probabilities agree with how often susceptibility is actually observed. For the ceftriaxone inpatient urine model, raw output was already close to calibrated overall (expected calibration error, 0.004) and at each site (0.004–0.013), and an isotonic transform did not improve it.

Reliability diagrams for the pooled ceftriaxone inpatient urine model, overall and for each of the four sites. Points lie close to the diagonal of perfect calibration. Raw expected calibration error is 0.004 overall, 0.013 at Stanford, 0.004 at ECUH, 0.008 at UTSW and 0.013 at MGB; isotonic recalibration gives 0.006, 0.013, 0.007, 0.007 and 0.015.
Reliability diagrams, ceftriaxone, inpatient urine. 27,960 held-out test orders; each point is one decile of predicted probability, and axes start at 0.3. Across the 23 pooled models, the choice between a transform and the raw output was made on test-set calibration error, so reported calibration across models is optimistic.

Exploratory operating points

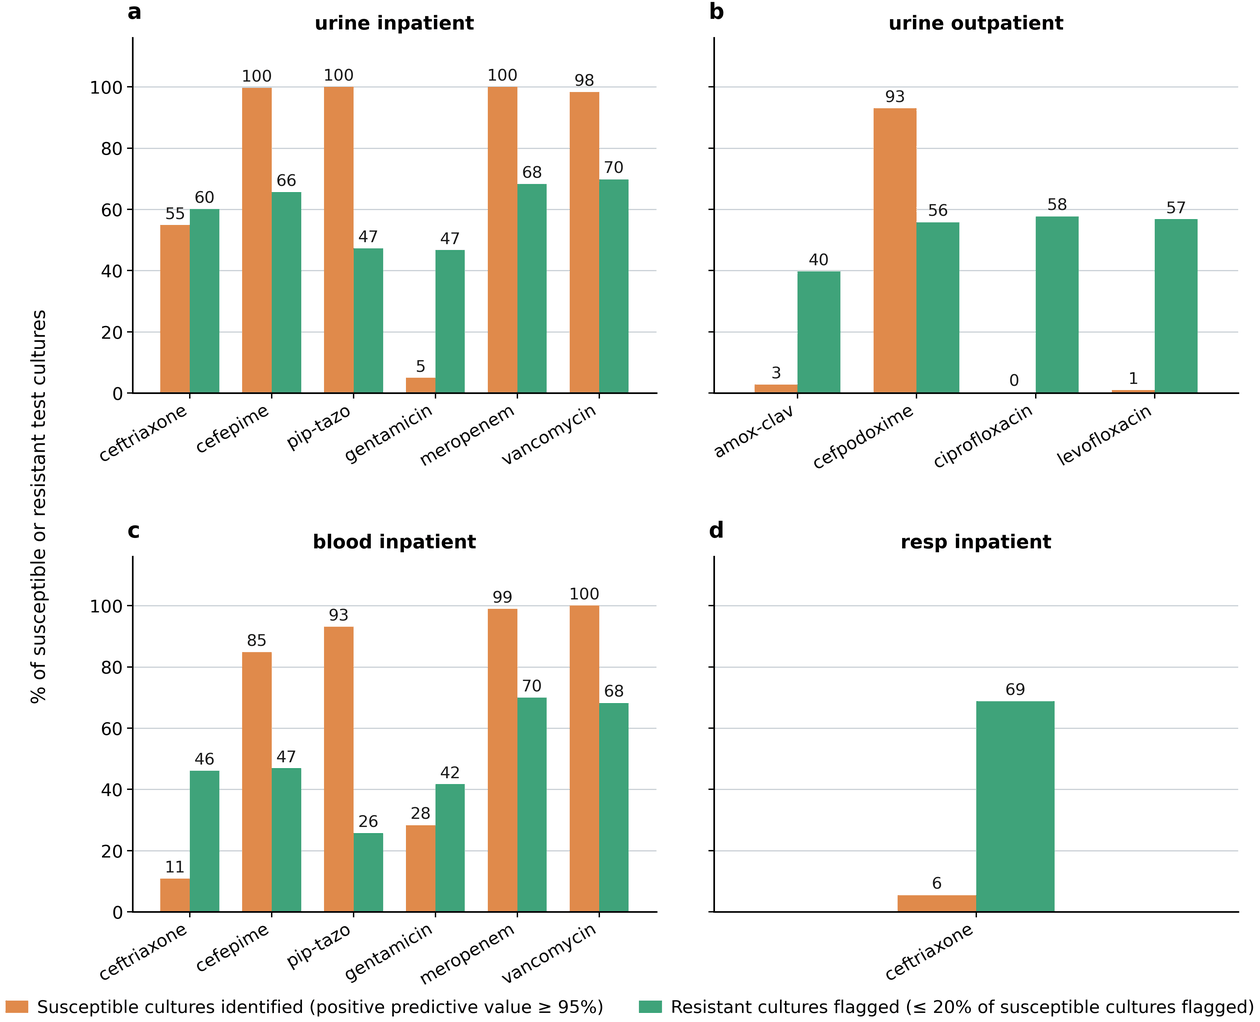
Two exploratory thresholds link a probability to a prescribing question. A high threshold identifies susceptible cultures, requiring that at least 95% of the cultures above it are susceptible (positive predictive value of at least 95%); a low threshold flags resistant cultures while flagging no more than 20% of susceptible ones. For ceftriaxone in inpatient urine cultures, 54.9% of susceptible orders were identified at the high threshold and 60.1% of resistant orders were flagged at the low threshold.

Bar charts of exploratory operating points for urine inpatient, urine outpatient, blood inpatient and respiratory inpatient models. Orange bars give the percentage of susceptible test cultures identified at the high threshold (positive predictive value of at least 95%); green bars give the percentage of resistant test cultures flagged at the low threshold (no more than 20% of susceptible cultures flagged). For example, urine inpatient ceftriaxone: 55 and 60; blood inpatient ceftriaxone: 11 and 46.
Exploratory operating points for identifying susceptible and flagging resistant cultures. Both thresholds were feasible for 17 of 23 models. The two thresholds were selected independently and do not form a single policy; in 9 of the 17 models the low threshold lay above the high threshold. Thresholds and yields were derived and evaluated on the same test orders, so they are candidate operating points for validation, not tested clinical rules.

Across the four hospitals

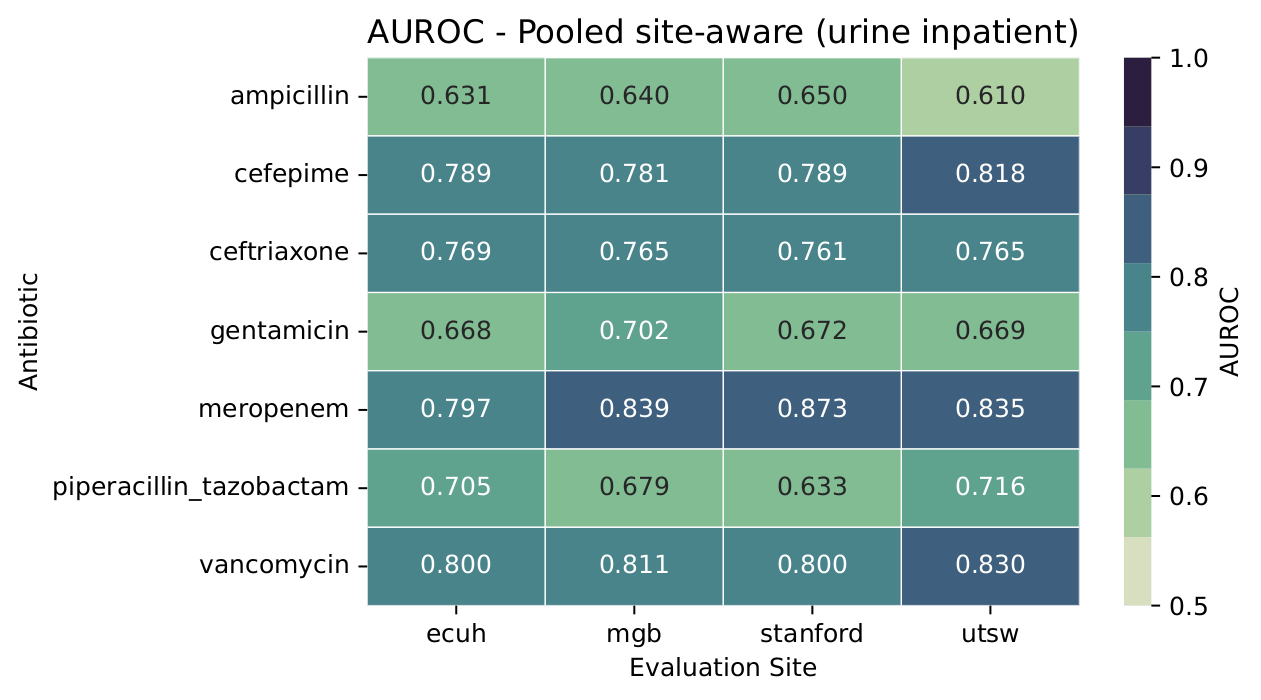
Every hospital contributed training data and was evaluated on its own share of the held-out split. For the site-aware development model, median AUROC across 28 inpatient urine antibiotic–site cells was 0.765. For the 23 pooled models in Table 1, across 87 reportable site-specific cells, hospital-specific median AUROC ranged from 0.691 to 0.715.

Heatmap of AUROC for seven inpatient urine antibiotics at four evaluation sites (ECUH, MGB, Stanford, UTSW) for the site-aware pooled model. Values range from 0.610 (ampicillin at UTSW) to 0.873 (meropenem at Stanford); ceftriaxone is between 0.761 and 0.769 at every site.
Site-aware pooled model, inpatient urine. This development model included a site indicator; the released models omit it. These results describe hospitals represented in training, not transfer to a new hospital.

Subgroup audit

For each model, the audit measured the spread between the highest and lowest AUROC across groups. Restricting to subgroups with at least 1,000 cultures reduced the median age-band range from 0.07 to 0.02, so small groups drove the largest differences.

0.02median AUROC range by sex
0.07median AUROC range by age band
0.05median AUROC range by ADI quintile
23models auditedrace and ethnicity were unavailable

Use your local antibiogram

Re-anchor to your hospital without retraining

A hospital with more resistance than the training sites would see estimates that are systematically too optimistic, even when the model ranks patients well. A prior-probability correction moves every estimate to the local resistance rate.

  1. Take the local resistance rate for the antibiotic, for example from your hospital's antibiogram.
  2. Each patient's odds of resistance are multiplied by the same factor: the local odds of resistance divided by the training odds. Patients keep their order, so discrimination (AUROC) is unchanged by construction.
  3. The correction assumes that only the overall resistance rate differs between hospitals, not the relationship between a patient's record and their result.
logit(plocal) = logit(pmodel) − logit(πtrain) + logit(πlocal)
Controlled prevalence sweep. At a 40% local resistance rate, median expected calibration error fell from 0.20 to 0.06 after re-anchoring, without changing discrimination.
Leave-one-site-out. Among site–model cells whose prevalence differed from training by at least 3 percentage points, re-anchoring reduced calibration error in 4 of 5 (mean, 0.061 to 0.037).
Caveat. The retrospective analysis used each held-out site's observed prevalence, which is stronger information than a hospital would usually have in advance. The web app's experimental local adjustment is a different, simpler method: it shifts each estimate by the difference between the local and training E. coli resistance rates, weighted by the share of that culture group's organisms that are E. coli. It has not itself been evaluated.

Citation

Cite this work

@unpublished{nateghiharedasht2026armdpredict,
  title  = {{ARMD-Predict}: Multi-Site Machine Learning to Predict Antibiotic Resistance before Culture Results},
  author = {Nateghi Haredasht, Fateme and Marshall, Nicholas P. and Chen, Wenyuan and Cooper, Lauren N. and Wei, Ziming and Konsker, Harrison and Chen, Jacob S. and Klompas, Michael and McKenna, Cara and Medford, Richard J. and Kanjilal, Sanjat and Schoeffler, Austin J. and Ma, Stephen P. and Banaei, Niaz and Asch, Steven M. and Chang, Amy and Deresinski, Stanley C. and Goldstein, Mary K. and Tibshirani, Robert and Chen, Jonathan H.},
  year   = {2026},
  note   = {Manuscript submitted for publication},
  url    = {https://healthrex.github.io/ARMD-Predict/}
}

Fateme Nateghi Haredasht and Nicholas P. Marshall contributed equally. If you use the datasets, please also cite the ARMD releases listed under Data.

Team

Authors and institutions

Stanford University

  • Fateme Nateghi Haredasht*,†
  • Nicholas P. Marshall*
  • Wenyuan Chen
  • Harrison Konsker
  • Jacob S. Chen
  • Austin J. Schoeffler
  • Stephen P. Ma
  • Niaz Banaei
  • Steven M. Asch
  • Amy Chang
  • Stanley C. Deresinski
  • Mary K. Goldstein
  • Robert Tibshirani
  • Jonathan H. Chen

Harvard Medical School and Harvard Pilgrim Health Care Institute

  • Ziming Wei
  • Michael Klompas
  • Cara McKenna
  • Sanjat Kanjilal

Brigham and Women's Hospital

  • Michael Klompas
  • Cara McKenna

UT Southwestern Medical Center

  • Lauren N. Cooper
  • Richard J. Medford

East Carolina University

  • Richard J. Medford

*Contributed equally. †Corresponding author: fnateghi@stanford.edu.

Full affiliations
  1. Division of Computational Medicine, Stanford University, Stanford, CA, USA
  2. Division of Infectious Diseases, Department of Pediatrics, Stanford University School of Medicine, Palo Alto, CA, USA
  3. Division of Clinical Informatics, Department of Pediatrics, Stanford University School of Medicine, Palo Alto, CA, USA
  4. Clinical Informatics Center, University of Texas Southwestern Medical Center, Dallas, TX, USA
  5. Department of Population Medicine, Harvard Medical School and Harvard Pilgrim Health Care Institute, Boston, MA, USA
  6. Division of Infectious Diseases, Department of Medicine, Brigham and Women's Hospital, Boston, MA, USA
  7. Brody School of Medicine, Department of Internal Medicine, East Carolina University, Greenville, NC, USA
  8. Department of Emergency Medicine, Department of Medicine, Stanford University School of Medicine, Stanford, CA, USA
  9. Division of Hospital Medicine, Department of Medicine, Stanford University School of Medicine, Stanford, CA, USA
  10. Division of Infectious Diseases and Geographic Medicine, Department of Medicine, Stanford University School of Medicine, Stanford, CA, USA
  11. Department of Pathology, Stanford University School of Medicine, Stanford, CA, USA
  12. Division of Primary Care and Population Health, Department of Medicine, Stanford University School of Medicine, Stanford, CA, USA
  13. Department of Health Policy, Stanford University School of Medicine, Stanford, CA, USA
  14. Department of Biomedical Data Science and Department of Statistics, Stanford University, Stanford, CA, USA
  15. Clinical Excellence Research Center, Stanford University School of Medicine, Stanford, CA, USA

Author numbering in the paper: Nateghi Haredasht 1; Marshall 2, 3; W. Chen 1; Cooper 4; Wei 5; Konsker 1; J. S. Chen 1; Klompas 5, 6; McKenna 5, 6; Medford 4, 7; Kanjilal 5; Schoeffler 8; Ma 9; Banaei 10, 11; Asch 12; Chang 10; Deresinski 10; Goldstein 13; Tibshirani 14; J. H. Chen 1, 9, 15.